Data display widgets help you present numbers, comparisons, schedules, time, weather, and other structured information on your website without custom code. These embeddable widgets make data easier for visitors to read, compare, and understand directly on the page.
With Jotform’s data display widgets, you can create tables, comparison tables, graphs, charts, weather displays, world clocks, and sunrise and sunset displays. They work well on business websites, product pages, pricing pages, reports, dashboards, event pages, travel websites, resource pages, and internal portals.
What can you do with data display widgets?
Data display widgets can help you:
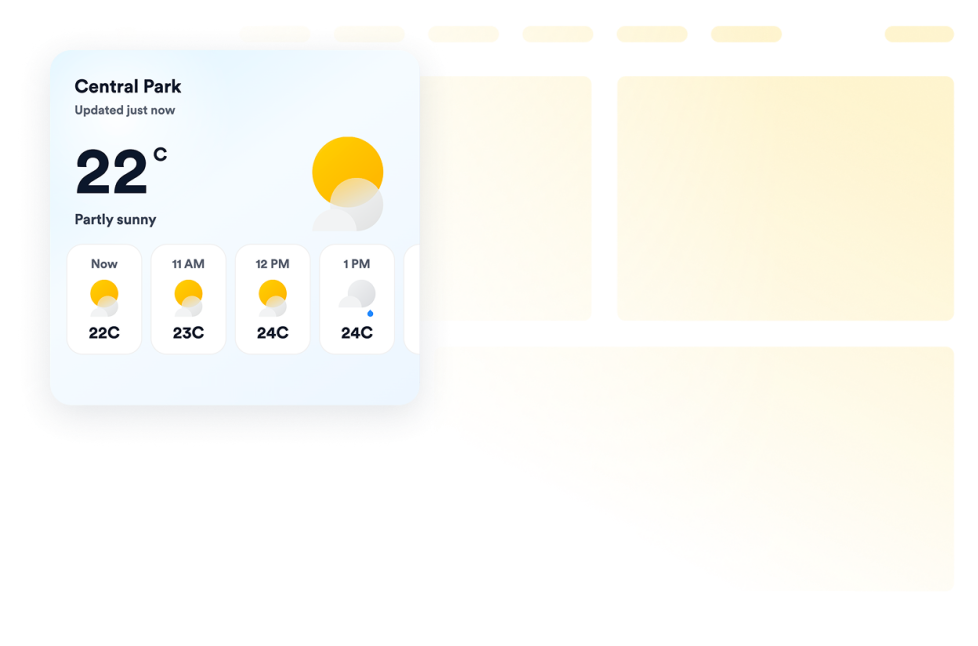
- Show current conditions and hourly or daily forecasts with a Weather widget
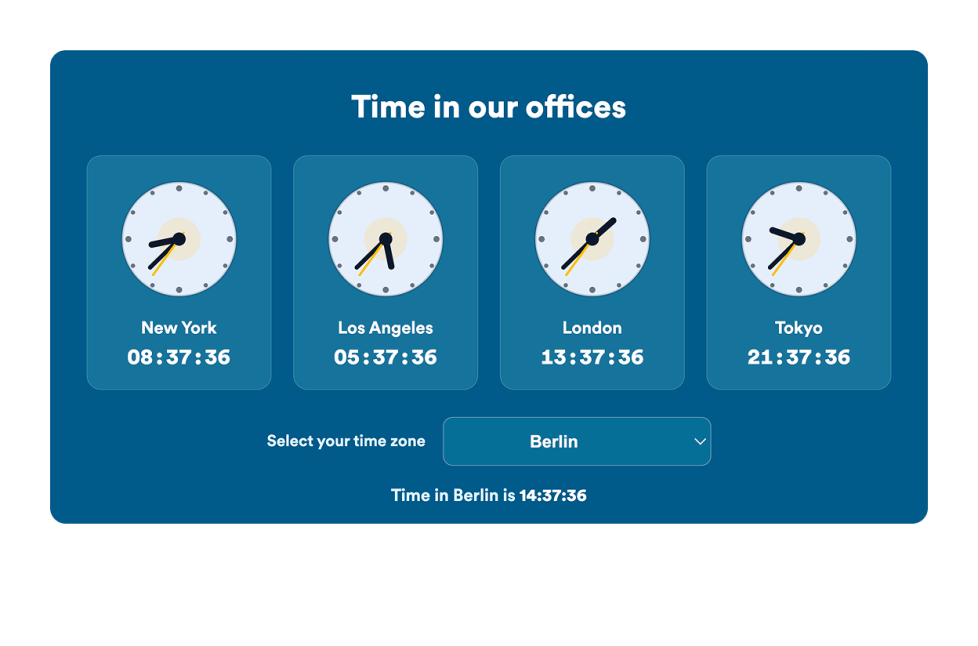
- Display analog or digital clocks for different offices, stores, events, or time zones
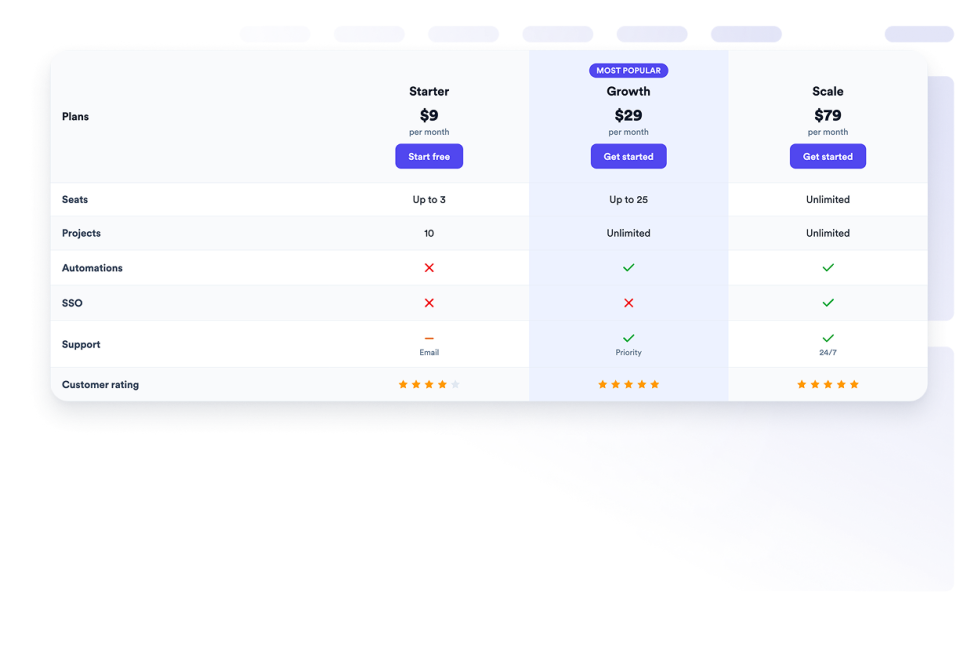
- Compare products, plans, services, or features in a Comparison Table
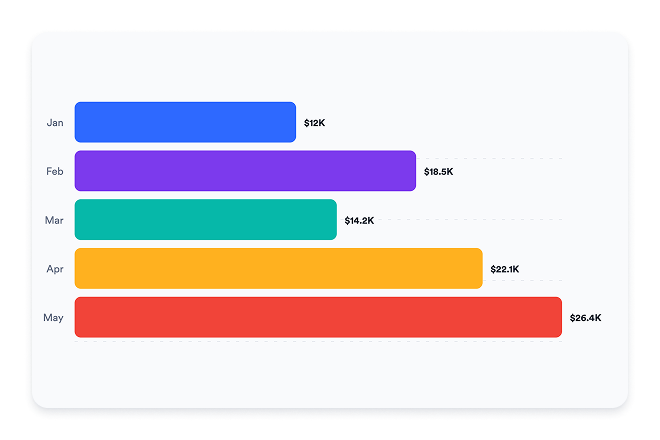
- Present numerical information using graphs and charts
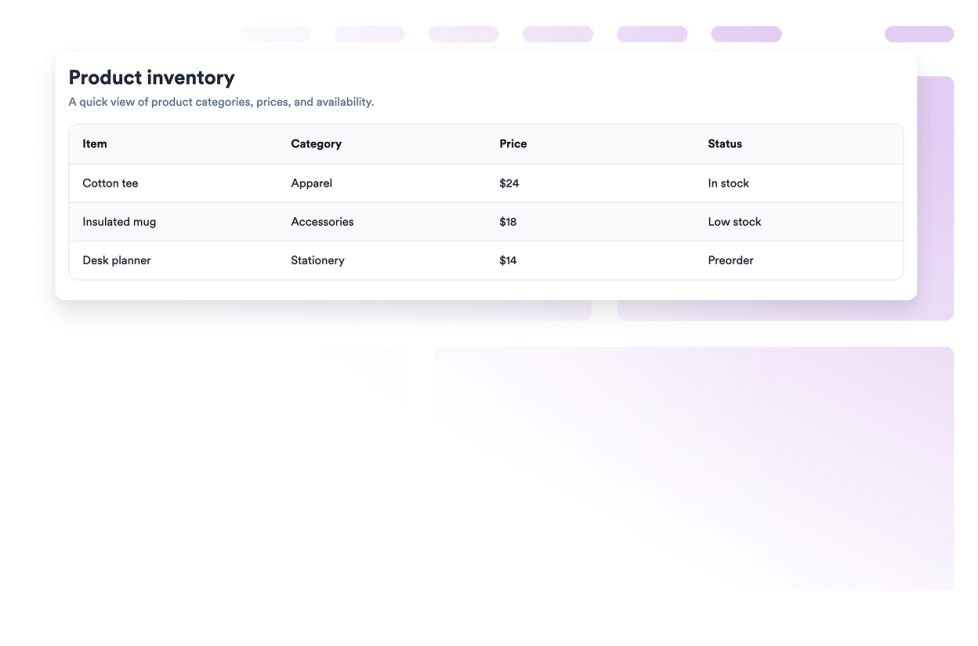
- Organize structured information in a responsive Table widget
- Add sticky headers and mobile card layouts to make tables easier to browse
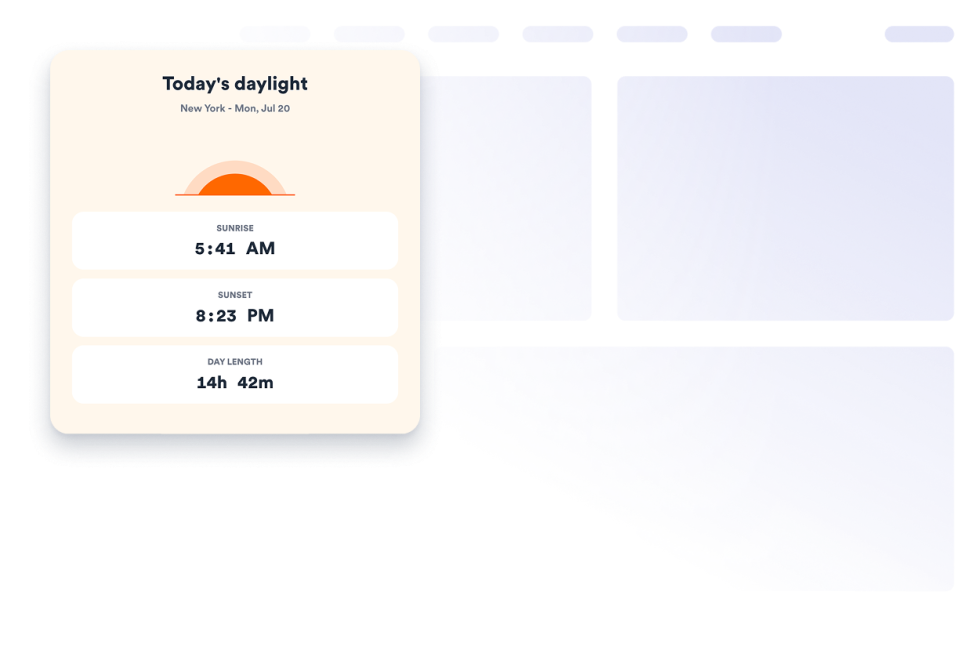
- Show sunrise time, sunset time, and day length for a selected city and time zone
- Adjust colors, labels, legends, layouts, and other display settings
- Keep useful information on your website instead of directing visitors to another tool
Popular data display widget use cases
Data display widgets can be used wherever visitors need to quickly understand structured information. Businesses can use a Comparison Table widget to place products, service packages, pricing plans, or features side by side. A Table widget can present schedules, directories, specifications, rates, or other information organized into rows and columns.
A Graphs and Charts widget can help display business figures, survey results, project data, or other numerical information in a visual format. Users can select a chart type and customize data, labels, legends, and colors to fit the page.
Travel websites, event pages, hotels, outdoor businesses, and local organizations can use a Weather widget to display current conditions and forecasts. A Clock widget can show time across offices, support regions, stores, or international events. The Sunrise Sunset widget can provide daily sunrise, sunset, and day-length information for a selected location.
Easy website widgets for any team
Embeddable data display widgets are useful for small businesses, marketing teams, educators, event organizers, travel companies, online stores, analysts, publishers, and website owners who need to present information without relying on a developer or designer.
With Jotform, users can choose a widget, enter or select the information to display, customize its settings and design, preview the result, and copy the embed code. They can then add it to a supported website editor or HTML section without custom code.
This makes it easier to publish tables, comparisons, charts, forecasts, and time-based information in a format that fits the surrounding website.
Related guides
To learn more about setting up and managing widgets, users can read Jotform’s guide on managing website widgets. The guide explains that users can create new widgets, edit existing widgets, copy embed codes, control widget visibility, and organize their widget assets from the My Website Widgets page.
What are data display widgets?
Data display widgets are embeddable website tools that present structured or time-based information in a readable format. They can include tables, comparison tables, graphs, charts, clocks, weather forecasts, and sunrise and sunset information.
What types of data can I display?
Depending on the widget, you can display editable table data, product or plan comparisons, numerical chart data, current weather, forecasts, world times, time zones, sunrise times, sunset times, and day length.
Where can I use data display widgets?
You can use them on product pages, pricing pages, business websites, reports, event pages, travel websites, educational resources, dashboards, and internal portals. The right placement depends on what visitors need to compare or understand.
Do data display widgets require coding?
No. You do not need a developer or designer. You can customize the widget, copy the embed code, and add it to your website without custom code. The exact placement steps depend on your website platform or page editor.